Windows 11: Using the Windows Task Manager for Performance Analysis
Windows 11 Task Manager: Your System's Secret Performance Decoder
Hey there, tech enthusiasts! Ever feel like your computer is speaking a language you just can't understand? It's sluggish, unresponsive, and basically acting like it's powered by a potato. We've all been there. Imagine your PC is a car. You can see it, you can use it, but you don't really know what's going on under the hood. Maybe the engine is sputtering, the tires are low, or the fuel injectors are clogged. Without the right tools, you're just guessing. And let's be honest, nobody wants to guess when their digital life is on the line.
You might've tried the classic "turn it off and on again" trick (because, let's face it, sometimes that actually works!), but what if the problem is deeper than that? What if some sneaky background process is hogging all your resources, leaving you stranded in digital slow-motion? Maybe you're a gamer and suddenly, your favorite game is running like a slideshow. Or perhaps you're a content creator, and rendering that video project feels like watching paint dry. Frustrating, right?
The truth is, understanding your computer's performance doesn't require a Ph D in computer science. Windows 11 has a built-in tool that's like a secret decoder ring for your system: the Task Manager. It’s often overlooked, dismissed as just a quick way to force-quit unresponsive apps. But trust us, it’s so much more than that. Think of the Task Manager as your personal system analyst, providing real-time data on everything from CPU usage to network activity. It's like having a mechanic for your digital car, able to diagnose problems and suggest solutions.
For years, the Task Manager was that unassuming app lurking in the background, only called upon when a program decided to lock up tighter than Fort Knox. But the modern Task Manager is a powerhouse of information. It's not just about ending processes anymore; it's about understanding what those processes are doing, how they're affecting your system, and what you can do to optimize performance. It can reveal hidden culprits that are slowing down your computer, allowing you to take control and reclaim your digital speed. It helps you understand the bottlenecks and inefficiencies hindering optimal performance. It's like having X-ray vision for your computer, allowing you to see exactly what's going on inside.
Imagine you're trying to stream your favorite show, but it keeps buffering. Is it your internet connection? Is it the streaming service? Or is it something else entirely? The Task Manager can help you pinpoint the problem. Or maybe you've noticed your laptop's battery life has suddenly plummeted. The Task Manager can show you which apps are the biggest power hogs, allowing you to make informed decisions about which ones to close or uninstall. It could even be something as simple as a rogue browser extension that's been secretly mining cryptocurrency in the background (yes, that happens!).
But navigating the Task Manager can be a bit daunting at first. All those numbers, graphs, and processes can feel overwhelming. Where do you even start? What do all those columns mean? And how do you actually use this information to improve your computer's performance? That’s exactly what we are going to explore. Get ready to become a Task Manager master, unlocking the secrets to a faster, smoother, and more responsive Windows 11 experience. Are you ready to dive in and transform your computer from a sluggish snail into a lightning-fast cheetah?
Unlocking the Power of Windows 11 Task Manager for Performance Analysis
Ready to transform your Windows 11 experience? The Task Manager is your secret weapon. It’s not just for force-quitting frozen apps anymore. It’s a comprehensive performance analysis tool that can help you diagnose and resolve slowdowns, optimize resource usage, and keep your system running smoothly.
Navigating the Task Manager Interface
First things first, let's get acquainted with the Task Manager's interface. It's more than just a list of running programs. Think of it as mission control for your PC.
• Opening the Task Manager: The Easiest Ways
There are multiple ways to open the Task Manager. Choose the one that suits you best:
• Press Ctrl + Shift + Esc: This is the quickest and most direct method.
• Right-click the Taskbar: Select "Task Manager" from the context menu.
• Press Ctrl + Alt + Delete: Choose "Task Manager" from the options.
• Search: Type "Task Manager" in the Windows search bar and press Enter.
Once you open the Task Manager, you'll likely see a simplified view. Click "More details" at the bottom to reveal the full interface.
• Key Tabs and Their Functions
The Task Manager is organized into several tabs, each providing different insights into your system's performance:
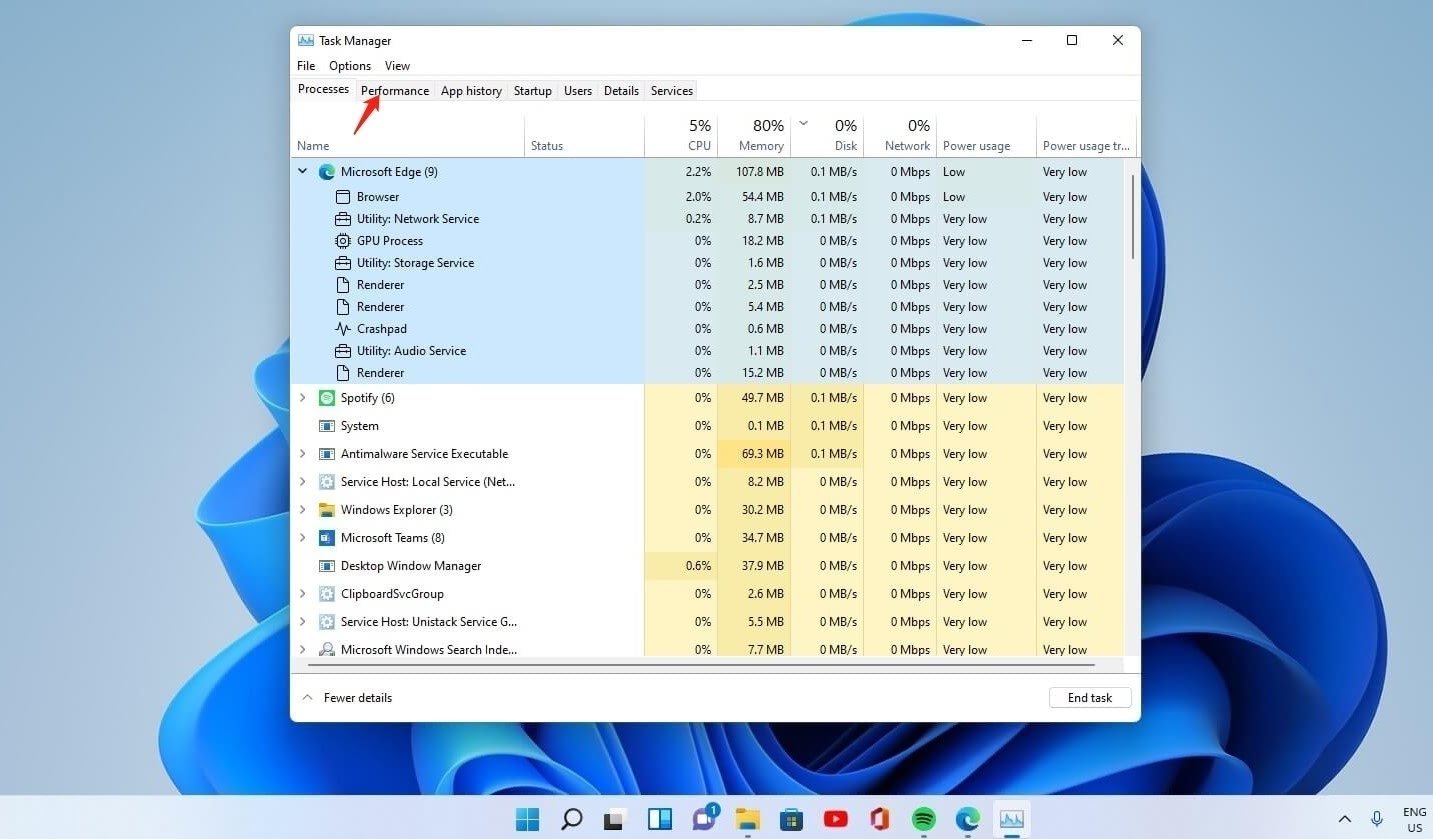
• Processes: Shows all running applications and background processes, along with their resource usage (CPU, Memory, Disk, Network, GPU, and Power Usage).
• Performance: Provides real-time graphs and data about your CPU, Memory, Disk, Network, and GPU usage.
• App history: Tracks resource usage of Universal Windows Platform (UWP) apps over time.
• Startup apps: Lists applications that automatically launch when you start your computer, allowing you to disable unnecessary ones.
• Users: Displays resource usage by each user account on the system.
• Details: Provides a more detailed view of processes, including their process ID (PID) and status.
• Services: Shows all system services, their status (running or stopped), and allows you to manage them.
Decoding the Processes Tab: Identifying Resource Hogs
The Processes tab is where you'll spend most of your time when analyzing performance. It shows a comprehensive list of everything running on your system, along with their resource consumption.
• Understanding the Columns: CPU, Memory, Disk, Network, GPU, and Power Usage
Each column in the Processes tab represents a different type of system resource:
• CPU: Shows the percentage of CPU time being used by each process. High CPU usage can indicate a demanding application or a runaway process.
• Memory: Shows the amount of RAM being used by each process. Excessive memory usage can lead to slowdowns and crashes.
• Disk: Shows the amount of disk activity generated by each process. High disk usage can slow down file operations and system responsiveness.
• Network: Shows the amount of network traffic generated by each process. High network usage can indicate a downloading or uploading application, or even malware activity.
• GPU: Shows the percentage of GPU time being used by each process. High GPU usage is common during gaming or other graphically intensive tasks.
• Power usage: This relatively new column shows the power consumption of each process. It can help you identify apps that are draining your laptop's battery.
• Sorting and Filtering Processes to Find the Culprits
To identify resource hogs, sort the processes by clicking on the column headers. For example, click "CPU" to sort processes by CPU usage, with the most demanding processes at the top.
• Sorting by CPU: Identify processes that are consistently using a high percentage of your CPU. These are prime suspects for slowdowns.
• Sorting by Memory: Find processes that are consuming excessive amounts of RAM. Closing or uninstalling these apps can free up memory and improve performance.
• Sorting by Disk: Identify processes that are generating a lot of disk activity. This could indicate a problem with the application or a failing hard drive.
• Sorting by Network: Find processes that are using a lot of network bandwidth. This could be due to downloading, uploading, or even unauthorized activity.
• Sorting by Power usage: Identify apps that are draining your laptop's battery. Close these apps when running on battery power.
• Identifying Unknown Processes: Researching and Addressing Suspicious Activity
Sometimes you'll see processes in the Task Manager that you don't recognize. Don't panic! It's likely a legitimate system process or a component of an application you've installed.
• Right-click the process: Select "Search online" to quickly find information about the process on the web. This can help you determine if it's legitimate or potentially malicious.
• Check the file path: Right-click the process and select "Open file location" to see where the process is located on your hard drive. This can give you clues about its purpose.
• Use a security tool: Run a scan with a reputable antivirus or anti-malware program to check for any threats.
If you suspect a process is malicious, immediately terminate it and run a full system scan.
The Performance Tab: A Real-Time Overview of System Resources
The Performance tab provides a visual representation of your system's resource usage. It's like a dashboard that gives you an at-a-glance overview of CPU, Memory, Disk, Network, and GPU activity.
• Monitoring CPU Usage: Identifying Bottlenecks and Overload
The CPU graph shows the percentage of CPU time being used over time. A consistently high CPU usage (above 80%) indicates a bottleneck. This means your CPU is struggling to keep up with the demands of your applications.
• Check the "Processes" tab: Identify which processes are contributing to the high CPU usage.
• Close unnecessary applications: Free up CPU resources by closing apps you're not using.
• Update drivers: Outdated drivers can sometimes cause CPU inefficiencies. Make sure your drivers are up to date.
• Scan for malware: Malware can consume CPU resources in the background. Run a scan with a reputable antivirus program.
• Analyzing Memory Usage: Detecting Memory Leaks and Insufficient RAM
The Memory graph shows the amount of RAM being used. If your memory usage is consistently high (above 90%), you may be running out of RAM. This can lead to slowdowns and frequent disk activity (paging).
• Close unnecessary applications: Free up memory by closing apps you're not using.
• Identify memory-hungry applications: Use the "Processes" tab to find which apps are consuming the most RAM.
• Upgrade your RAM: If you consistently run out of memory, consider upgrading to a larger capacity RAM module.
• Disk Activity and Performance: Identifying Slow Hard Drives and I/O Bottlenecks
The Disk graph shows the amount of disk activity. High disk activity can slow down file operations and system responsiveness. This is especially true if you're using a traditional hard drive (HDD) instead of a solid-state drive (SSD).
• Check the "Processes" tab: Identify which processes are generating the most disk activity.
• Defragment your hard drive: If you're using an HDD, defragmenting it can improve performance.
• Upgrade to an SSD: If you're still using an HDD, upgrading to an SSD can dramatically improve system performance.
• Network Utilization: Monitoring Bandwidth Usage and Identifying Network Hogs
The Network graph shows the amount of network traffic. High network usage can indicate a downloading or uploading application, or even malware activity.
• Check the "Processes" tab: Identify which processes are generating the most network traffic.
• Close unnecessary applications: Free up network bandwidth by closing apps you're not using.
• Scan for malware: Malware can consume network bandwidth in the background. Run a scan with a reputable antivirus program.
• GPU Performance Monitoring: Understanding Graphics Card Usage
The GPU graph shows the percentage of GPU time being used. High GPU usage is common during gaming or other graphically intensive tasks.
• Check the "Processes" tab: Identify which applications are using the GPU.
• Update drivers: Outdated drivers can cause GPU performance issues. Make sure your drivers are up to date.
• Adjust graphics settings: Lowering the graphics settings in games or other applications can reduce GPU load.
Managing Startup Apps: Speeding Up Boot Times
The Startup apps tab lists applications that automatically launch when you start your computer. Disabling unnecessary startup apps can significantly speed up boot times.
• Identifying and Disabling Unnecessary Startup Programs
Go through the list of startup apps and disable any that you don't need to launch automatically. Be cautious when disabling apps, as some may be essential for system functionality.
• Disable apps you rarely use: If you only use an app occasionally, there's no need for it to launch automatically.
• Research unknown apps: If you're not sure what an app does, search online before disabling it.
• Monitor performance after disabling: After disabling startup apps, monitor your system's boot time and overall performance.
Advanced Task Manager Features: Details and Services Tabs
The Details and Services tabs offer more advanced information and control over processes and services running on your system.
• Using the Details Tab for Process Management
The Details tab provides a more detailed view of processes, including their process ID (PID), status, and user account.
• Finding specific processes: Use the "Name" column to find a specific process.
• Checking process status: The "Status" column shows whether a process is running, suspended, or unresponsive.
• Ending processes: Right-click a process and select "End task" to terminate it. Use caution when ending processes, as some may be essential for system functionality.
• Understanding and Managing Windows Services
The Services tab shows all system services, their status (running or stopped), and allows you to manage them.
• Understanding service status: The "Status" column shows whether a service is running or stopped.
• Starting and stopping services: Right-click a service and select "Start" or "Stop" to control its status. Be extremely cautious when managing services, as disabling essential services can cause system instability.
• Changing startup type: Right-click a service and select "Properties" to change its startup type (Automatic, Manual, or Disabled). This determines when the service will start. Again, be extremely cautious when changing service startup types.
Real-World Examples and Case Studies
Let's look at some real-world examples of how the Task Manager can help you troubleshoot performance issues:
• Case Study 1: Slow Boot Times
A user complains about slow boot times. Using the Task Manager, they identify several unnecessary startup apps that are launching automatically. By disabling these apps, they significantly reduce boot times.
• Case Study 2: High CPU Usage
A user experiences high CPU usage even when no applications are running. Using the Task Manager, they identify a malware process that is consuming CPU resources in the background. After removing the malware, CPU usage returns to normal.
• Case Study 3: Memory Leaks
A user notices that their computer becomes sluggish after running a specific application for a long time. Using the Task Manager, they identify that the application is leaking memory. They report the issue to the software developer, who releases a fix.
Tips and Tricks for Advanced Performance Analysis
Here are some additional tips and tricks for using the Task Manager for advanced performance analysis:
• Using Resource Monitor for In-Depth Analysis
The Resource Monitor is a more advanced tool that provides even more detailed information about system resource usage. You can access it from the Performance tab by clicking the "Open Resource Monitor" link.
• Monitoring Performance Over Time: Using Performance Monitor
The Performance Monitor allows you to track system performance over time and create detailed reports. This can be useful for identifying long-term trends and diagnosing intermittent issues.
• Third-Party Task Manager Alternatives
While the Windows Task Manager is a powerful tool, there are also several third-party alternatives available that offer additional features and functionality. Examples include Process Explorer and System Explorer.
Frequently Asked Questions
Here are some frequently asked questions about using the Windows 11 Task Manager for performance analysis:
• Question: How do I know if a process is safe to end?
Answer: If you're not sure what a process does, search online for its name. If it's a system process, it's generally not safe to end. If it's a third-party application process, you can usually end it without causing problems, but you may lose unsaved data.
• Question: What is a memory leak?
Answer: A memory leak occurs when an application allocates memory but doesn't release it properly. This can lead to the application consuming more and more memory over time, eventually causing slowdowns and crashes.
• Question: How can I improve my computer's performance?
Answer: There are many ways to improve your computer's performance, including closing unnecessary applications, disabling startup apps, upgrading your RAM, upgrading to an SSD, and scanning for malware.
• Question: Is it safe to disable Windows services?
Answer: It's generally not safe to disable Windows services unless you know exactly what you're doing. Disabling essential services can cause system instability and prevent Windows from functioning properly. If you're not sure, it's best to leave the services alone.
Congratulations, friends! You've just become a Task Manager guru! Armed with this knowledge, you're now equipped to diagnose performance issues, optimize resource usage, and keep your Windows 11 system running smoothly. Remember, the Task Manager is your digital stethoscope, allowing you to listen to your system's heartbeat and identify any potential problems. Don't be afraid to explore its features and experiment with different settings. The more you use it, the more comfortable you'll become with it, and the better you'll be able to keep your computer running at its best.
Now, it's time to put your newfound skills to the test! Take a few minutes to open the Task Manager on your own computer and see what you can discover. Are there any resource hogs lurking in the background? Are there any unnecessary startup apps slowing down your boot time? Are there any services that you can safely disable? The possibilities are endless!
We encourage you to share your experiences in the comments below. What are some of the most interesting things you've discovered using the Task Manager? What are some of the challenges you've faced? And what are some tips and tricks that you've learned along the way? By sharing our knowledge and experiences, we can all become better at using the Task Manager to keep our computers running at their best.
So, what are you waiting for? Go forth and conquer your system's performance! And remember, a well-tuned computer is a happy computer! Happy tinkering, and may your digital adventures be swift and seamless! Now, tell us, what's the first thing you're going to check in your Task Manager?
Post a Comment for "Windows 11: Using the Windows Task Manager for Performance Analysis"
Post a Comment