Linux System Monitoring: Identifying and Resolving Performance Bottlenecks
Linux System Monitoring: Your Guide to Slaying Performance Dragons
Linux System Monitoring: Identifying and Resolving Performance Bottlenecks is crucial for maintaining a healthy and responsive system, ensuring your servers aren't secretly plotting a digital rebellion.
Hey there, tech adventurers! Ever felt like your Linux server is running slower than a snail in peanut butter? You're not alone! We've all been there – staring at a loading screen, wondering if your code is actuallydoinganything or just taking a very long coffee break. The struggle is real. Sometimes, it feels like your server is deliberately trying to sabotage your productivity. Like, it knows you have a deadline and decides to take a nap.
Imagine this: You're about to launch a new feature that's been weeks in the making. The marketing team is ready, the press releases are drafted, and all that's left is hitting the "deploy" button. You click...and nothing. The server grinds to a halt, the error logs start piling up, and your users are greeted with a blank screen. Nightmare fuel, right? This is where Linux system monitoringcomes in.
Think of it like this: your Linux system is a complex machine, like a Formula 1 car. You wouldn't send a Formula 1 car onto the track without monitoring its engine temperature, tire pressure, and fuel levels, would you? Similarly, you need to keep tabs on your server's CPU usage, memory consumption, disk I/O, and network traffic. If you don't, you're basically driving blindfolded, hoping for the best (and usually crashing spectacularly).
But let's be honest, the world of system monitoring can seem intimidating. There are so many tools, metrics, and jargon that it's easy to get lost in the weeds. Where do you even start? How do you make sense of all that data? And more importantly, how do you actually fix those pesky performance bottlenecks? The good news is, it doesn't have to be rocket science.
The internet is awash with 'solutions', but finding practical, actionable advice that speaks your language can be a challenge. Many guides assume you're already a guru, throwing around terms like "iostat" and "vmstat" without explaining what they actuallymean. We're aiming to demystify all that. We’ll give you practical advice you can usetodayto improve your system's performance.
What if you could quickly identify the root cause of those slowdowns? What if you could proactively prevent performance issues before they impact your users? What if you could finally tame that unruly server and make it purr like a well-oiled machine?
This article is your guide to doing just that. We'll walk you through the essential tools and techniques for monitoring your Linux systems, identifying performance bottlenecks, and implementing effective solutions. No more guesswork, no more frantic Googling, just practical strategies you can use to keep your servers running smoothly. Get ready to become a performance whisperer! So, buckle up and let's dive in! Are you ready to learn how to keep your Linux system humming along like a finely tuned engine? Let's get started!
Understanding the Basics of Linux System Monitoring
Why Monitor Your Linux System?
Ignoring Linux performance monitoringis like ignoring the check engine light in your car. Sure, youcankeep driving, but eventually, something is going to break down, and it's probably going to be at the most inconvenient time possible. Monitoring provides insights into resource usage, helping anticipate and prevent problems before they occur. A stitch in time saves nine, as they say.
Think about it. If your website suddenly starts experiencing high traffic, wouldn't you want to knowwhy? Is it a legitimate surge in users, or is it a malicious DDo S attack? Is your database struggling to keep up with the increased load? Is your application leaking memory like a sieve? Monitoring gives you the answers to these questions, allowing you to take proactive steps to address the issues.
Furthermore, understanding the baseline performance of your system is crucial for capacity planning. By tracking resource usage over time, you can predict when you'll need to upgrade your hardware or optimize your software. This helps avoid situations where you're scrambling to add more resources at the last minute, potentially leading to downtime and frustrated users.
Essentially,system monitoringis about being proactive rather than reactive. It's about having the information you need to make informed decisions, prevent problems, and keep your systems running smoothly. It also helps optimize resource allocation, leading to cost savings and improved efficiency.
Key Metrics to Monitor
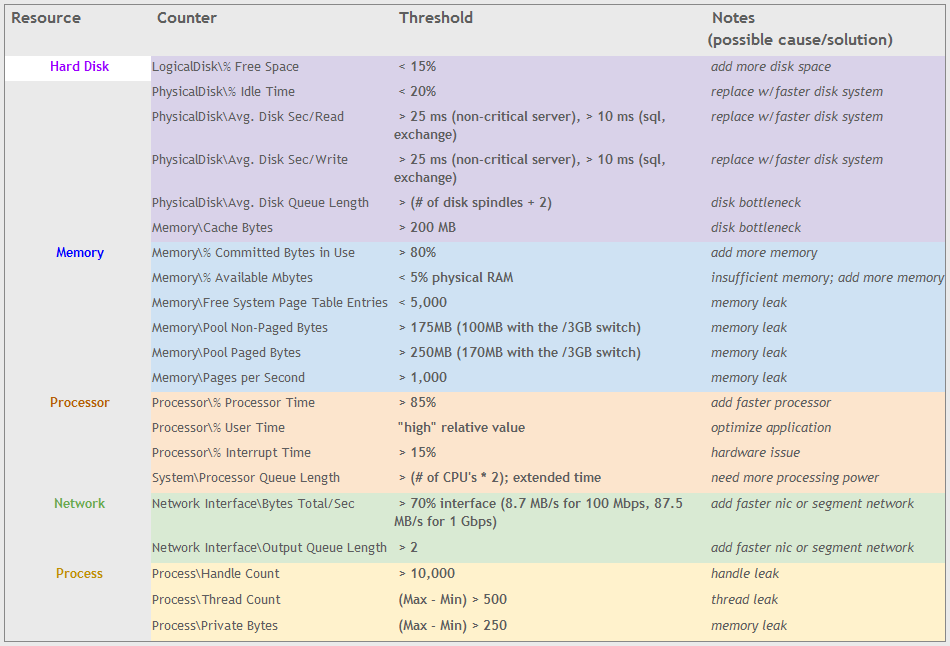
Knowingwhatto monitor is half the battle. Here are some essential metrics you should be tracking:CPU Usage: This indicates how much processing power your system is currently using. High CPU usage can be a sign of a runaway process, inefficient code, or simply that your server is overloaded. You'll want to keep an eye onuser, system, idle, andiowaitpercentages. Memory Usage: This tells you how much RAM your system is using. High memory usage can lead to swapping, which slows down performance significantly. Monitorused, free, cached, andbufferedmemory. Disk I/O: This measures the rate at which data is being read from and written to your hard drives. High disk I/O can indicate a bottleneck in your storage system. Pay attention toread/write speeds, IOPS (Input/Output Operations Per Second), anddisk utilization. Network Traffic: This shows the amount of data being sent and received over your network interfaces. High network traffic can be a sign of a network bottleneck, a security breach, or simply that your server is handling a lot of traffic. Keep track ofbandwidth usage, packet loss, andlatency. Disk Space: Monitor the amount of free space available on your hard drives. Running out of disk space can cause all sorts of problems, including application crashes and data loss. Process States: Tracking process states can provide insights into resource-intensive operations. This is a great indicator of overallsystem health.
Essential Linux Monitoring Tools
Fortunately, Linux comes with a wealth of built-in tools formonitoring system performance. Here are a few of the most essential: top: This interactive tool displays a real-time view of the most resource-intensive processes on your system. It's a great way to quickly identify processes that are consuming excessive CPU or memory. htop: Similar to top, but with a more user-friendly interface and more features. It's often considered a more powerful and versatile alternative to top. vmstat: This command provides information about virtual memory, CPU activity, disk I/O, and more. It's a useful tool for identifying system-wide performance bottlenecks. iostat: This command reports CPU utilization and disk I/O statistics. It's invaluable for diagnosing disk-related performance issues. netstat/ss: These commands display network connections, routing tables, and interface statistics. They're helpful for troubleshooting network problems and identifying network bottlenecks. The `ss` command is generally preferred these days, as it's faster and more powerful than `netstat`. df: This command shows the amount of disk space used and available on your file systems. It's essential for monitoring disk space usage and preventing out-of-space errors. free:This command displays the amount of free and used memory on your system. It's a quick and easy way to check your memory usage.
These tools are command-line based, which can be intimidating for some users. However, they're incredibly powerful and versatile. Once you get the hang of them, you'll be able to diagnose performance problems like a pro. There are also many graphical monitoring tools available, but mastering the command-line tools is a valuable skill for any Linux system administrator.
Identifying Performance Bottlenecks
CPU Bottlenecks
A CPU bottleneck occurs when the CPU is the limiting factor in your system's performance. This means that the CPU is running at or near 100% utilization, and other resources, such as memory and disk I/O, are waiting for the CPU to catch up.
Symptoms
High CPU utilization (near 100%)
Slow application performance
System sluggishness
Common Causes
CPU-intensive processes (e.g., compiling code, video encoding)
Inefficient code
Too many processes running concurrently
Insufficient CPU power for the workload
Solutions
Identify and optimize CPU-intensive processes: Usetoporhtopto identify the processes that are consuming the most CPU. Then, analyze the code to identify areas that can be optimized. Upgrade your CPU: If your CPU is consistently running at high utilization, it may be time to upgrade to a faster processor. Increase the number of CPU cores: If your workload is highly parallel, adding more CPU cores can significantly improve performance. Load balancing: Distribute the workload across multiple servers to reduce the load on any single CPU. Process Prioritization:Tools like `nice` and `renice` can adjust the priority of processes, allowing critical tasks to receive more CPU time.
Memory Bottlenecks
A memory bottleneck occurs when your system doesn't have enough RAM to handle the workload. This leads to swapping, where the system moves data from RAM to the hard drive to free up memory. Swapping ismuchslower than accessing RAM, so it can significantly degrade performance.
Symptoms
High memory usage
Excessive swapping
Slow application performance
Common Causes
Memory leaks
Inefficient memory usage by applications
Too many applications running concurrently
Insufficient RAM
Solutions
Identify and fix memory leaks: Use memory profiling tools to identify applications that are leaking memory. Optimize memory usage: Analyze your application code to identify areas where memory usage can be reduced. Increase RAM: Adding more RAM is often the simplest and most effective solution for memory bottlenecks. Reduce the number of running applications: Close any unnecessary applications to free up memory. Optimize swap settings:Adjust theswappinesssetting to control how aggressively the system uses swap space.
Disk I/O Bottlenecks
A disk I/O bottleneck occurs when the hard drive is the limiting factor in your system's performance. This means that the CPU and memory are waiting for the hard drive to read or write data.
Symptoms
High disk I/O utilization
Slow application performance
Slow file transfers
Common Causes
Too many processes accessing the hard drive concurrently
Slow hard drive
Disk fragmentation
Inefficient database queries
Solutions
Identify and optimize disk-intensive processes: Useiostatto identify the processes that are generating the most disk I/O. Upgrade to a faster hard drive: Consider upgrading to a solid-state drive (SSD), which offers significantly faster read/write speeds than traditional hard drives. Defragment your hard drive: Disk fragmentation can slow down performance. Defragmenting your hard drive can improve performance, especially if you're using a traditional hard drive. Optimize database queries: Inefficient database queries can generate a lot of disk I/O. Optimizing your queries can significantly reduce disk I/O and improve performance. RAID configuration:Using RAID (Redundant Array of Independent Disks) can improve disk performance and provide data redundancy.
Network Bottlenecks
A network bottleneck occurs when the network is the limiting factor in your system's performance. This means that the CPU, memory, and hard drive are waiting for data to be sent or received over the network.
Symptoms
High network traffic
Slow application performance
Slow file transfers
High latency
Common Causes
Network congestion
Slow network connection
Faulty network hardware
Network security issues (e.g., DDo S attacks)
Solutions
Identify and address network congestion: Use network monitoring tools to identify sources of network congestion. Upgrade your network connection: If your network connection is too slow, consider upgrading to a faster connection. Check your network hardware: Ensure that your network hardware (e.g., routers, switches, network cards) is functioning properly. Implement network security measures: Protect your network from security threats such as DDo S attacks. Content Delivery Network (CDN):Utilizing a CDN can reduce latency and improve performance for users accessing your content from different geographical locations.
Resolving Performance Bottlenecks: Practical Strategies
Optimizing CPU Usage
Optimizing CPU usage involves reducing the amount of time the CPU spends processing tasks, either by making those tasks more efficient or by reducing the number of tasks the CPU has to handle.
Techniques
Code Profiling: Use profiling tools to identify performance bottlenecks in your code. Then, optimize the code to reduce CPU usage. Caching: Implement caching mechanisms to store frequently accessed data in memory, reducing the need to repeatedly compute or retrieve the data from disk. Asynchronous Processing: Use asynchronous processing to offload long-running tasks to background threads or processes, freeing up the CPU to handle other tasks. Load Balancing: Distribute the workload across multiple servers to reduce the load on any single CPU. Reduce Unnecessary Processes:Identify and eliminate any unnecessary processes that are consuming CPU resources.
Optimizing Memory Usage
Optimizing memory usage involves reducing the amount of RAM that your applications and system processes consume.
Techniques
Memory Profiling: Use memory profiling tools to identify memory leaks and inefficient memory usage patterns in your code. Garbage Collection Tuning: If you're using a programming language with garbage collection, tune the garbage collector settings to optimize memory management. Data Compression: Use data compression techniques to reduce the amount of memory required to store data. Lazy Loading: Load data only when it's needed, rather than loading everything up front. Shared Libraries:Use shared libraries to reduce the amount of memory required by multiple applications.
Optimizing Disk I/O
Optimizing disk I/O involves reducing the amount of time it takes to read and write data to the hard drive.
Techniques
Caching: Implement caching mechanisms to store frequently accessed data in memory, reducing the need to read the data from disk. Data Compression: Use data compression techniques to reduce the amount of data that needs to be written to disk. Disk Scheduling: Use disk scheduling algorithms to optimize the order in which disk requests are processed. File System Tuning: Tune your file system settings to optimize disk I/O performance. Solid-State Drives (SSDs):Use SSDs instead of traditional hard drives to significantly improve disk I/O performance.
Optimizing Network Performance
Optimizing network performance involves reducing latency and increasing bandwidth to improve the speed and reliability of network communication.
Techniques
Caching: Implement caching mechanisms to store frequently accessed data closer to the user, reducing latency. Content Delivery Network (CDN): Use a CDN to distribute your content across multiple servers around the world, reducing latency for users in different geographical locations. Compression: Use data compression techniques to reduce the amount of data that needs to be transmitted over the network. TCP Tuning: Tune your TCP settings to optimize network performance. Load Balancing:Distribute network traffic across multiple servers to prevent any single server from becoming overloaded.
Continuous Monitoring and Alerting
Setting Up Monitoring Dashboards
While command-line tools are powerful, they're not ideal for long-term monitoring. Setting up monitoring dashboards provides a visual and centralized way to track system performance metrics over time.
Popular Tools
Grafana: A popular open-source data visualization and monitoring platform. Prometheus: An open-source monitoring and alerting toolkit. Nagios: A widely used monitoring system for servers, services, and applications. Zabbix: An enterprise-class open-source distributed monitoring solution.
These tools allow you to create custom dashboards that display real-time and historical data for key performance metrics. You can also configure alerts to be notified when metrics exceed predefined thresholds.
Configuring Alerts
Alerting is a critical component of system monitoring. It allows you to be notified automatically when performance issues arise, so you can take corrective action before they impact your users.
Types of Alerts
CPU Usage Alerts: Triggered when CPU utilization exceeds a certain threshold. Memory Usage Alerts: Triggered when memory usage exceeds a certain threshold. Disk I/O Alerts: Triggered when disk I/O utilization exceeds a certain threshold. Network Traffic Alerts: Triggered when network traffic exceeds a certain threshold. Disk Space Alerts: Triggered when disk space falls below a certain threshold. Service Availability Alerts: Triggered when a critical service becomes unavailable.
Alerting Channels
Email: Receive alerts via email. SMS: Receive alerts via SMS. Pager Duty: Integrate with Pager Duty for on-call management. Slack: Receive alerts in a Slack channel.
Automating Monitoring Tasks
Automating monitoring tasks can save you time and effort, and ensure that your systems are being monitored consistently.
Techniques
Cron Jobs: Use cron jobs to schedule regular monitoring tasks, such as collecting system metrics and generating reports. Ansible: Use Ansible to automate the deployment and configuration of monitoring tools. Puppet: Use Puppet to manage the configuration of your monitoring infrastructure. Chef: Use Chef to automate the deployment and configuration of monitoring tools.
By automating monitoring tasks, you can ensure that your systems are being monitored consistently and that you're alerted to potential problems in a timely manner.
Conclusion: Mastering Linux Performance for a Smoother Ride
We've covered a lot of ground in this exploration of Linux System Monitoring: Identifying and Resolving Performance Bottlenecks. From understanding the crucial role monitoring plays in maintaining a healthy and responsive system to diving deep into essential tools, metrics, and practical strategies for tackling performance bottlenecks, the goal was to equip you with the knowledge and skills needed to become a true performance whisperer. Remember those initial feelings of being overwhelmed by jargon and complex processes? Hopefully, now that the basics have been discussed, everything should be a lot easier.
The journey to mastering Linux performance monitoring is an ongoing process. Technology evolves, workloads change, and new challenges will inevitably arise. What remains constant is the importance of continuous monitoring, proactive problem-solving, and a commitment to learning and adapting.
The core of all of this information rests on having the ability to monitor and resolve performance bottlenecks, optimizing CPU, memory, disk I/O, and network performance. The use of the tools and methods has been covered along with practical strategies that can be implemented immediately.
Ultimately, mastering Linux system performanceisn't just about technical skills; it's about problem-solving, critical thinking, and a dedication to providing a smooth and reliable experience for your users.
Now it's your turn.Take the knowledge you've gained from this article and apply it to your own Linux systems. Start by setting up monitoring dashboards, configuring alerts, and experimenting with different optimization techniques. Don't be afraid to make mistakes and learn from them. The more you practice, the more confident and proficient you'll become. Embrace the challenge, stay curious, and never stop learning.
Ready to transform your Linux systems from sluggish snails into high-performing racehorses? Start implementing these strategies today and witness the difference!
Post a Comment for "Linux System Monitoring: Identifying and Resolving Performance Bottlenecks"
Post a Comment